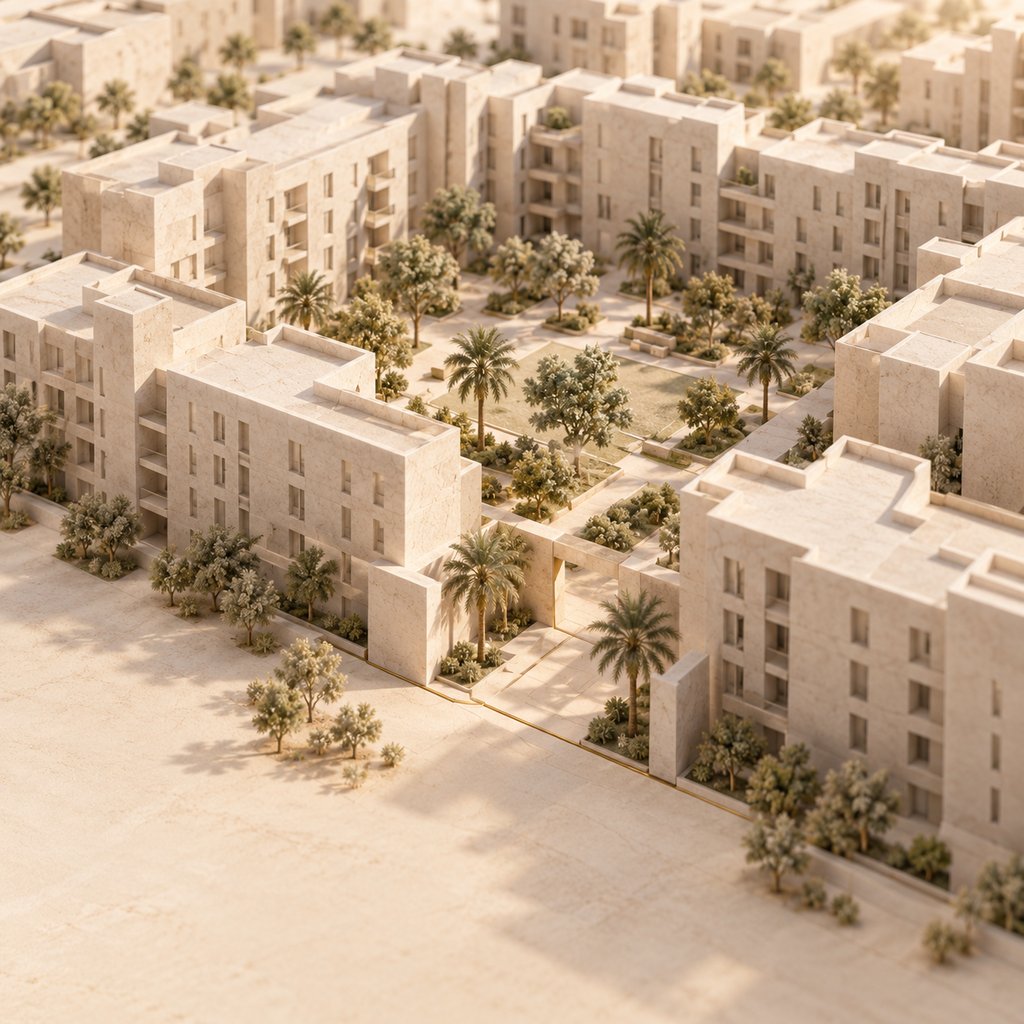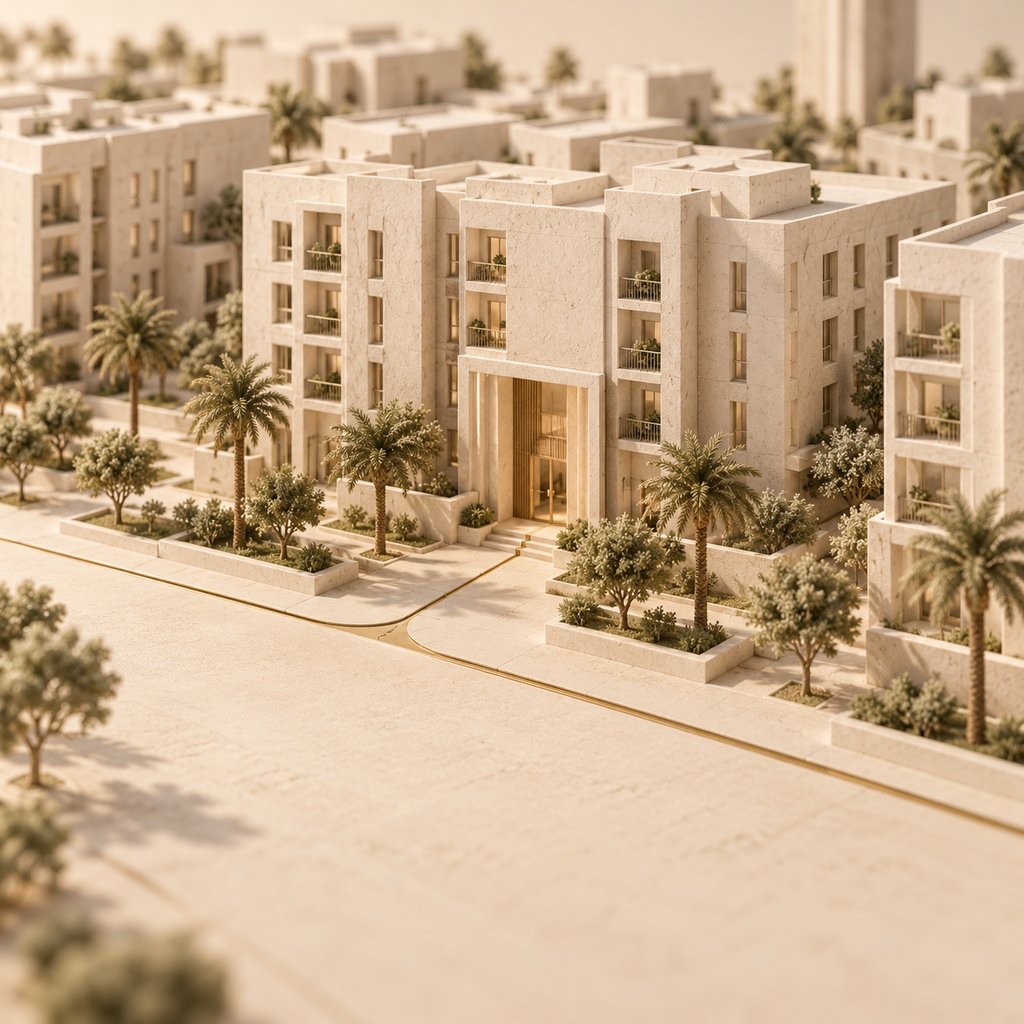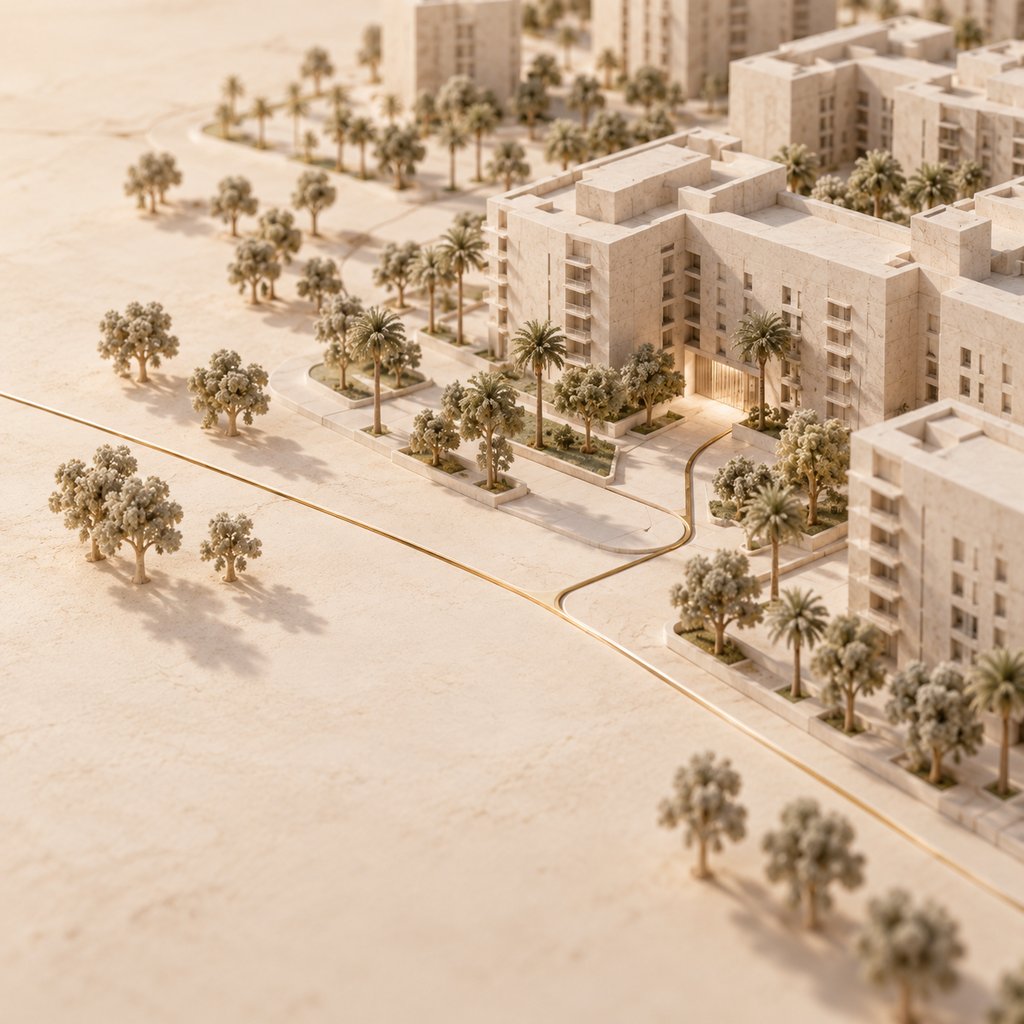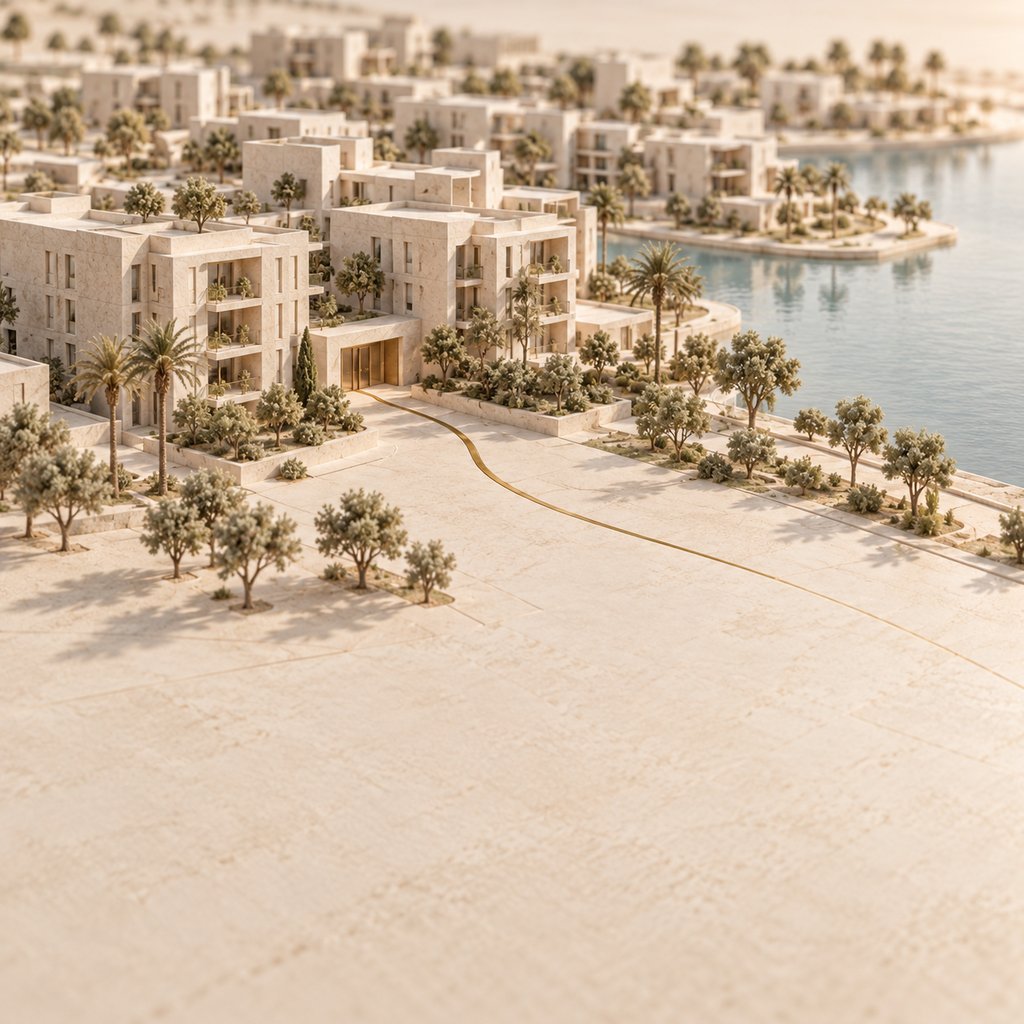
Dubailand prices, rents, communities and living here (2026)
Across nine Dubailand communities, the Dubai Land Department (DLD) recorded 8,697 sales in the 12 months to 11 November 2026, with medians of AED 1,448 per sq ft on 6,413 qualifying Off-Plan sales and AED 1,074 per sq ft on 1,623 qualifying Ready sales. The median annual rent was AED 57,000 across 1,852 new one-bedroom flat contracts in the 12 months to 12 November 2026 (DLD).
Dubai Properties
AED 1,408 / sq ft
AED 57,000 / year
8,697
From the month's registers.
The DLD registered 225 sales in the matched communities from 1 to 11 November 2026.
Contents
- 01What is the Dubailand area?
- 02Where is Dubailand on the map?
- 03How many properties sold in Dubailand each year?
- 04What does a square foot cost in Dubailand?
- 05What does it cost to buy or rent a home in Dubailand?
- 06Which Dubailand districts and buildings had the most sales?
- 07Which projects are in Dubailand, and who builds them?
- 08What is it like to live in Dubailand?
- 09How can you check a Dubailand address with the DLD?
- 10Questions about Dubailand
- 11How this record is made
What is the Dubailand area?
Dubailand is a group of inland Dubai communities with apartments in Dubai Land Residence Complex and Remraam, townhouses in Villanova and detached homes in The Villa. Across the nine communities covered here, DLD registrations in the 12 months to 11 November 2026 had medians of AED 1,448 per sq ft on 6,413 qualifying Off-Plan sales and AED 1,074 per sq ft on 1,623 qualifying Ready sales.
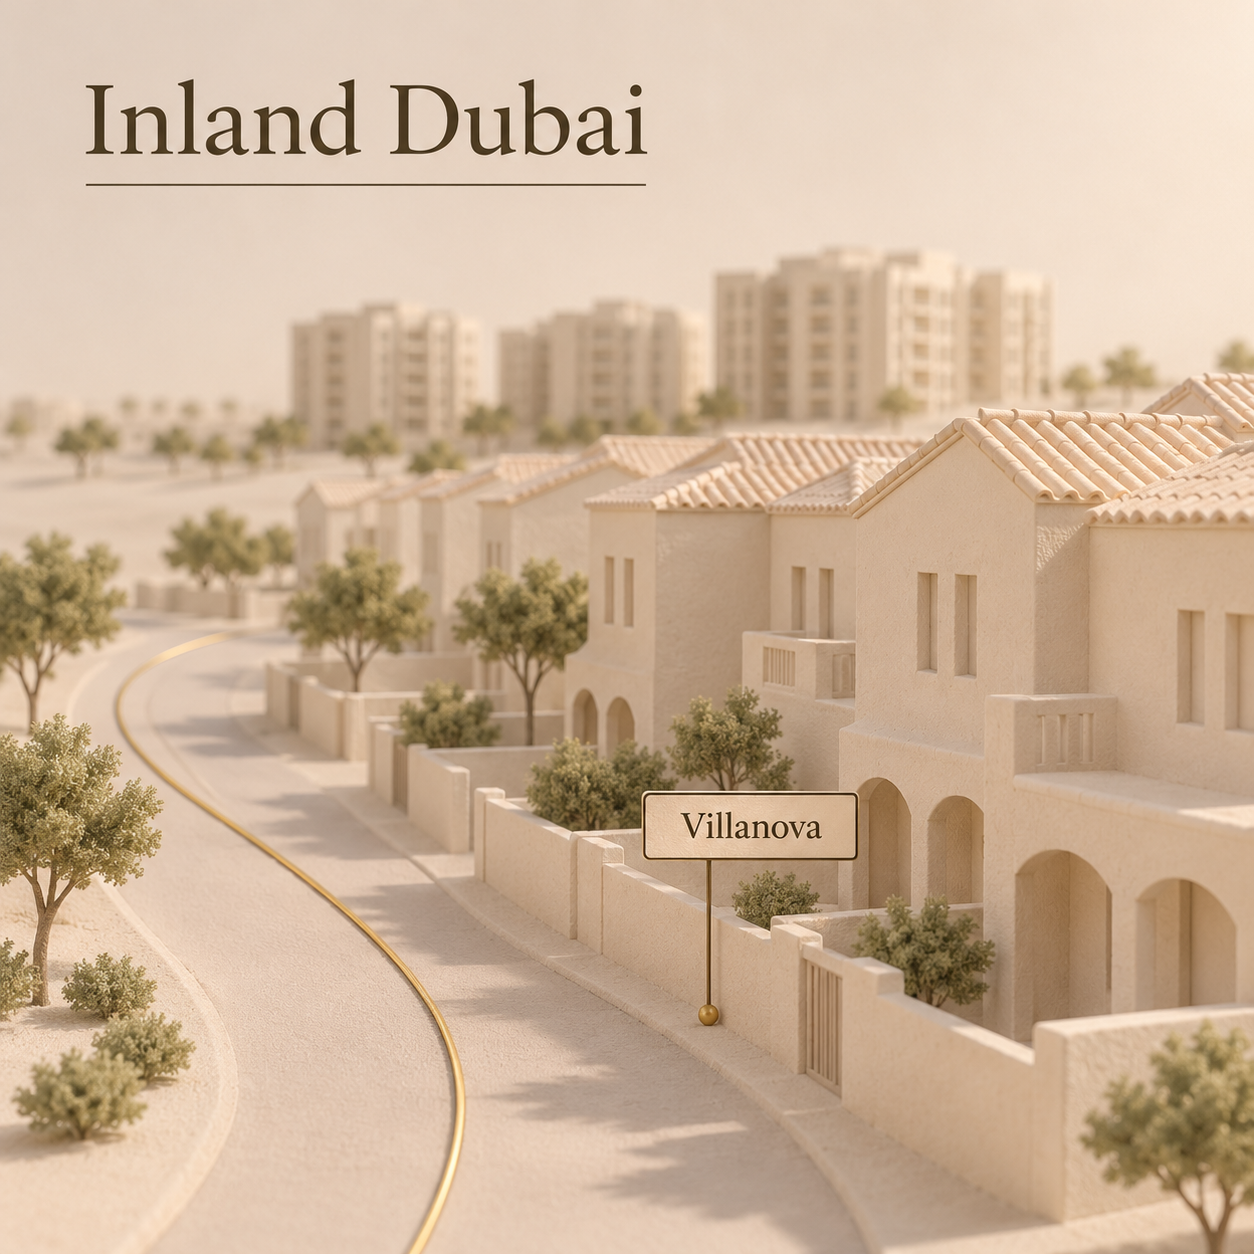
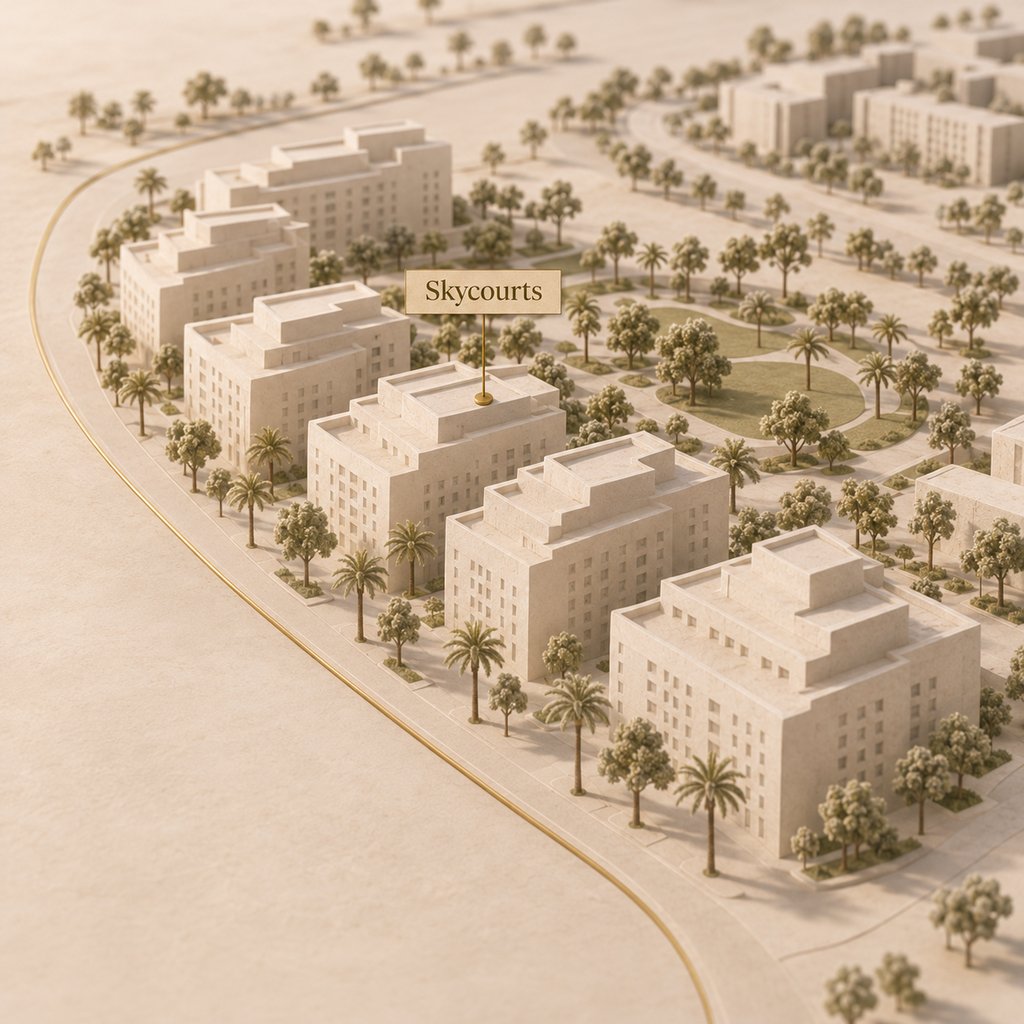
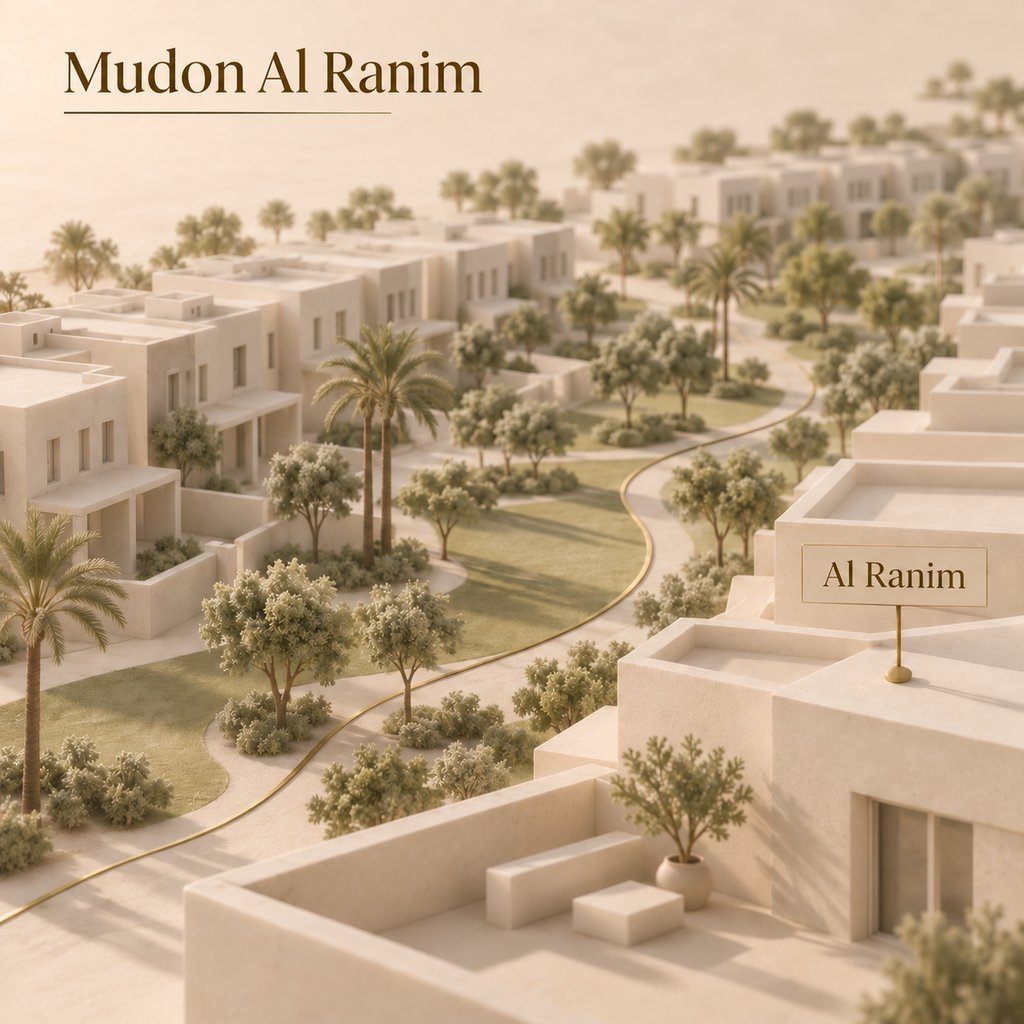
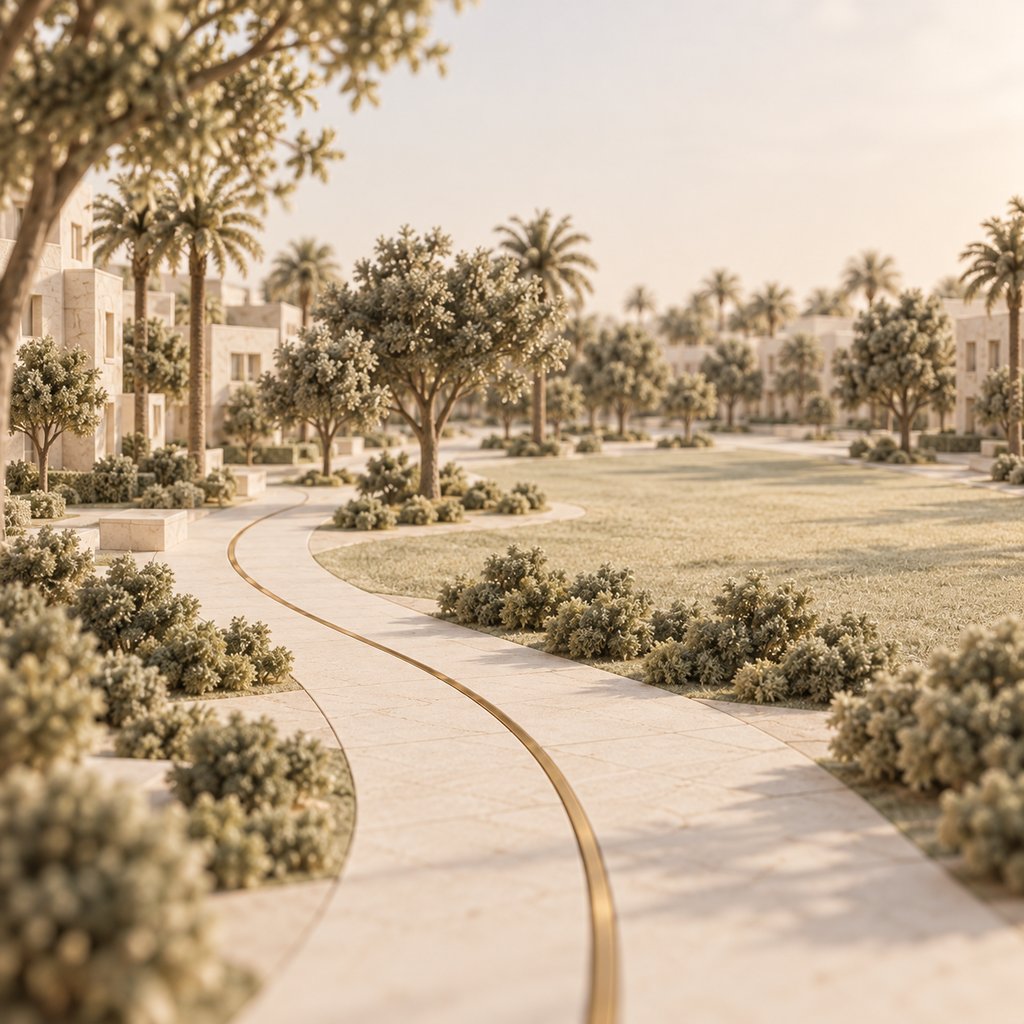
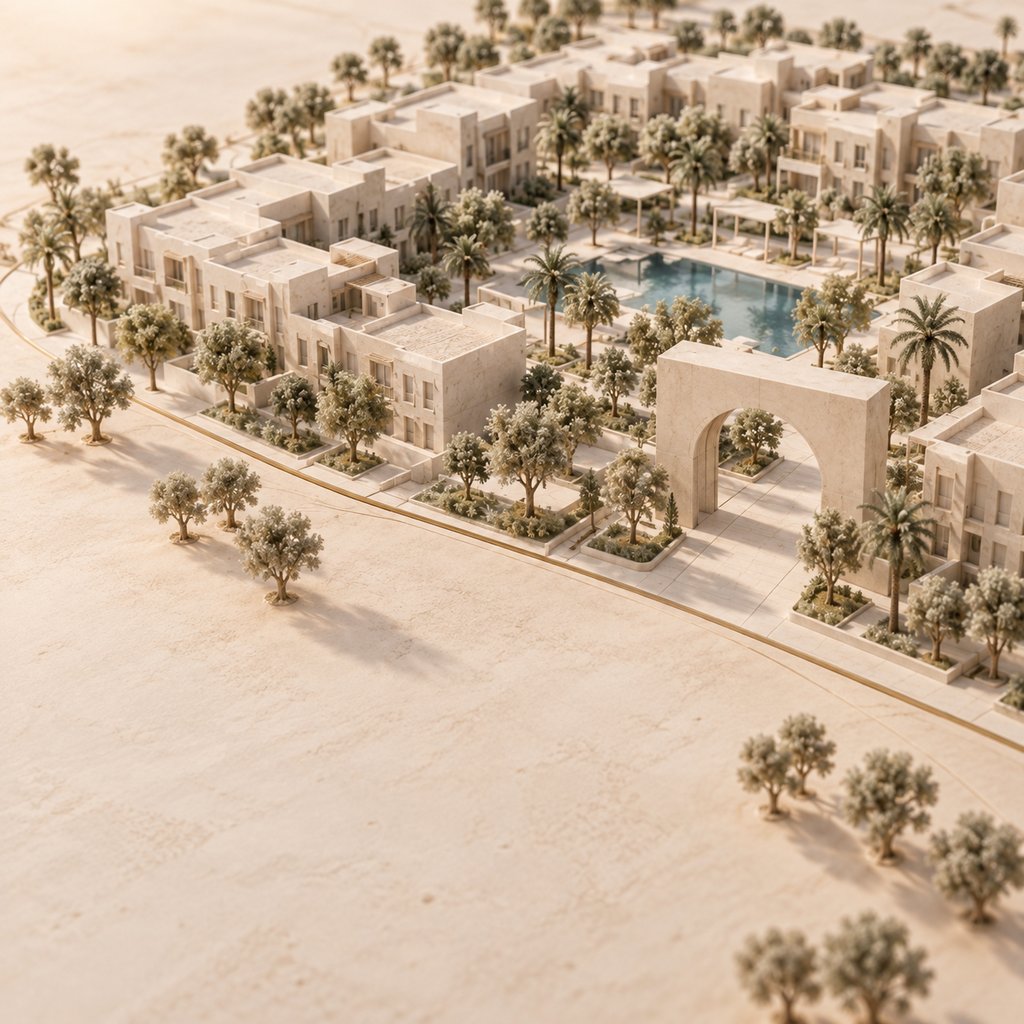
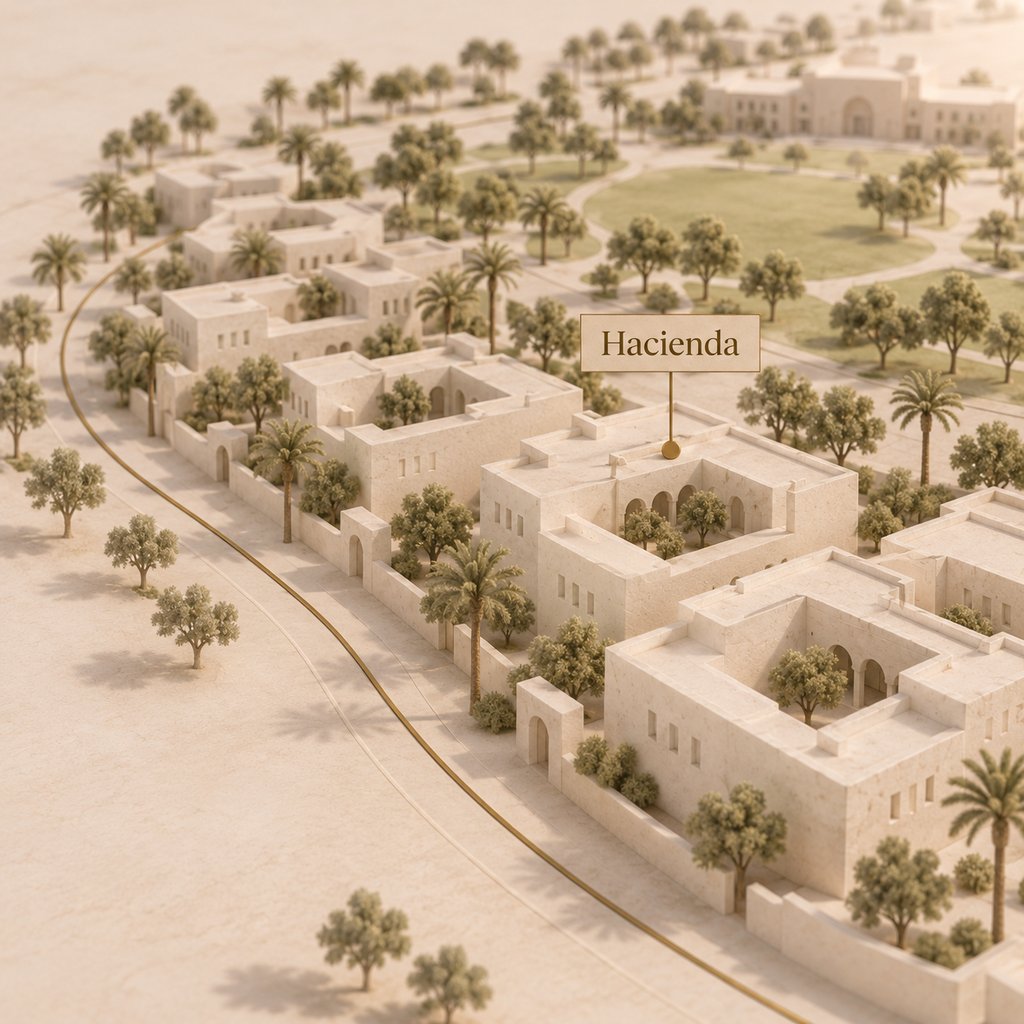
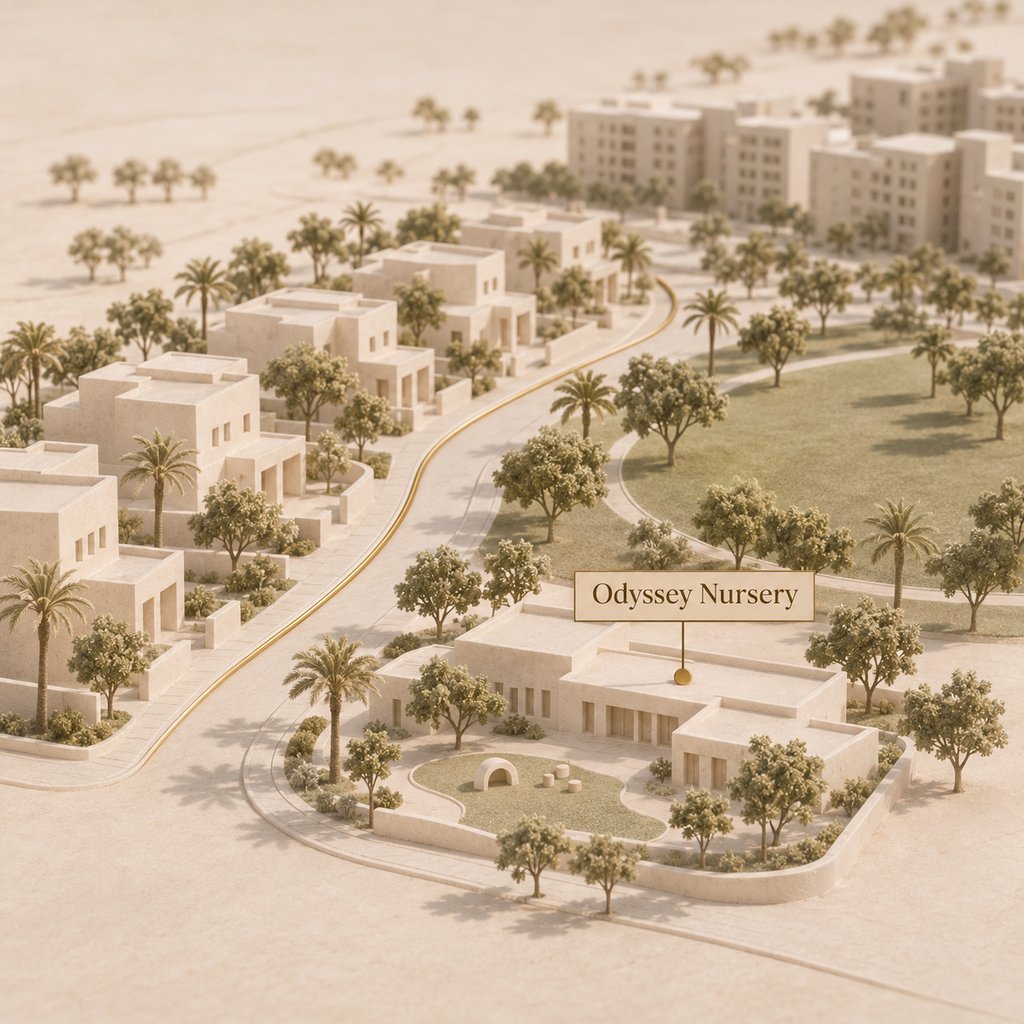
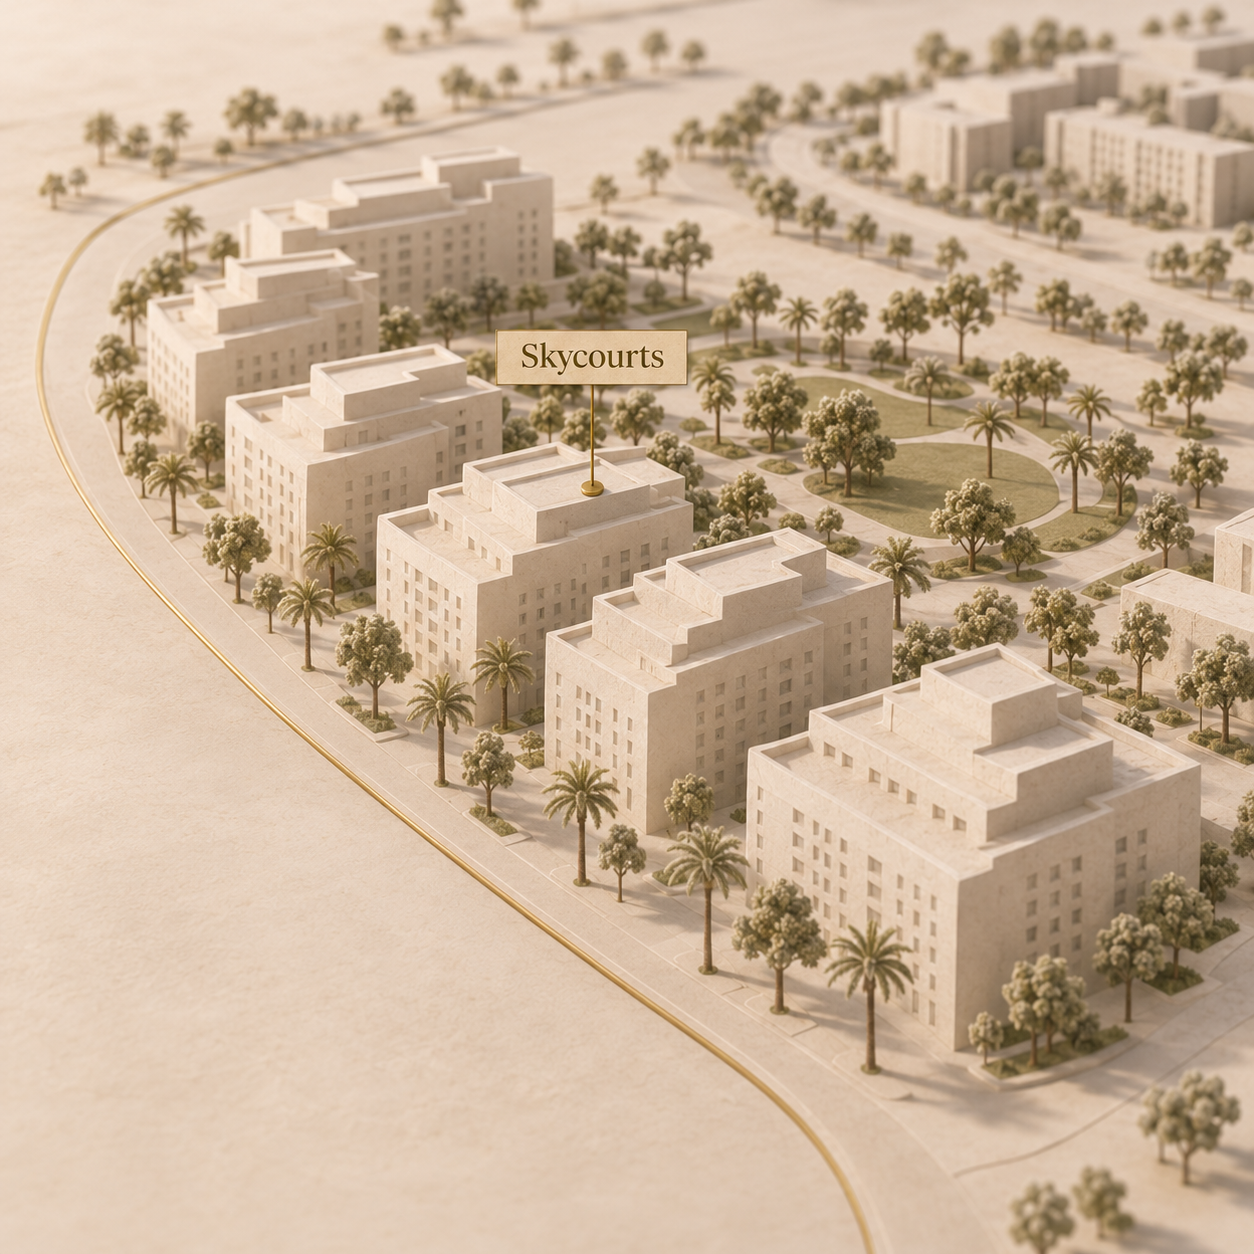
The community name on the address tells you a good deal more than the word Dubailand. At Skycourts, the tower name identifies an apartment building inside Dubai Land Residence Complex. At Villanova, a name such as La Rosa identifies a townhouse phase. Dubai Properties sets out the relationship between these names on its destination and community pages. Its Dubailand portfolio includes Serena, Mudon, The Villa, Al Waha and Remraam as well as Villanova.
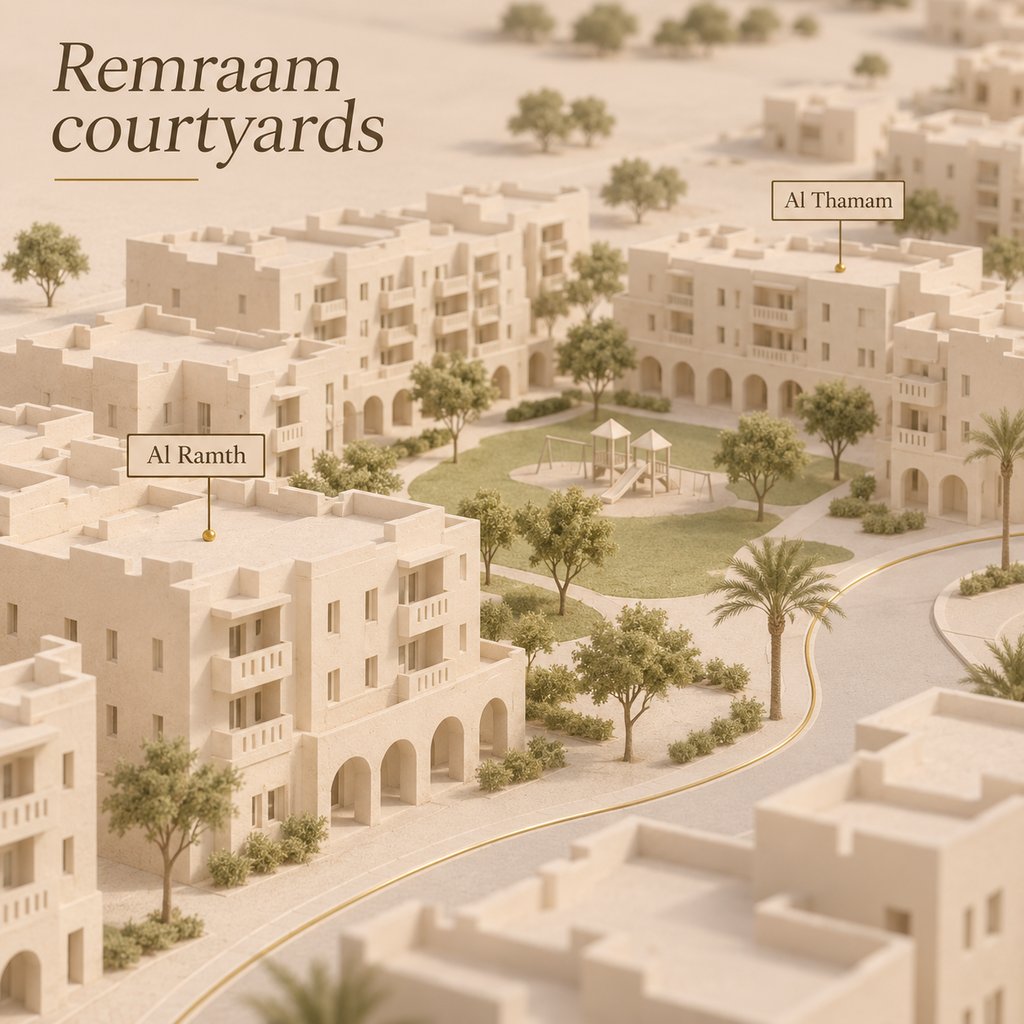
The figures on this page also include Dubai Land Residence Complex, Living Legends and The Acres. Together these places give you a view of homes at different stages of their lives, from the original apartment blocks in Remraam to villas registered for sale before completion. They cover the communities named here. Across the wider destination, a Dubailand postal address alone doesn't put a property into the figures.
If you're renting a flat, the new-contract column describes people starting a tenancy. The separate renewal column describes people signing again. Both use the annual amount on a registered agreement, so a monthly instalment or an advertised asking rent belongs to a different comparison.
- Off-Plan6,595 · 76%
- Ready2,102 · 24%
Where is Dubailand on the map?
Dubailand stretches across neighbourhoods served by Dubai–Al Ain Road, Emirates Road and Sheikh Zayed bin Hamdan Al Nahyan Street. From the Dubai Land map pin near Villanova, Dubai Mall in Downtown is 24.7 km by road, a 21-minute drive without traffic (OpenStreetMap, 15 November 2026).
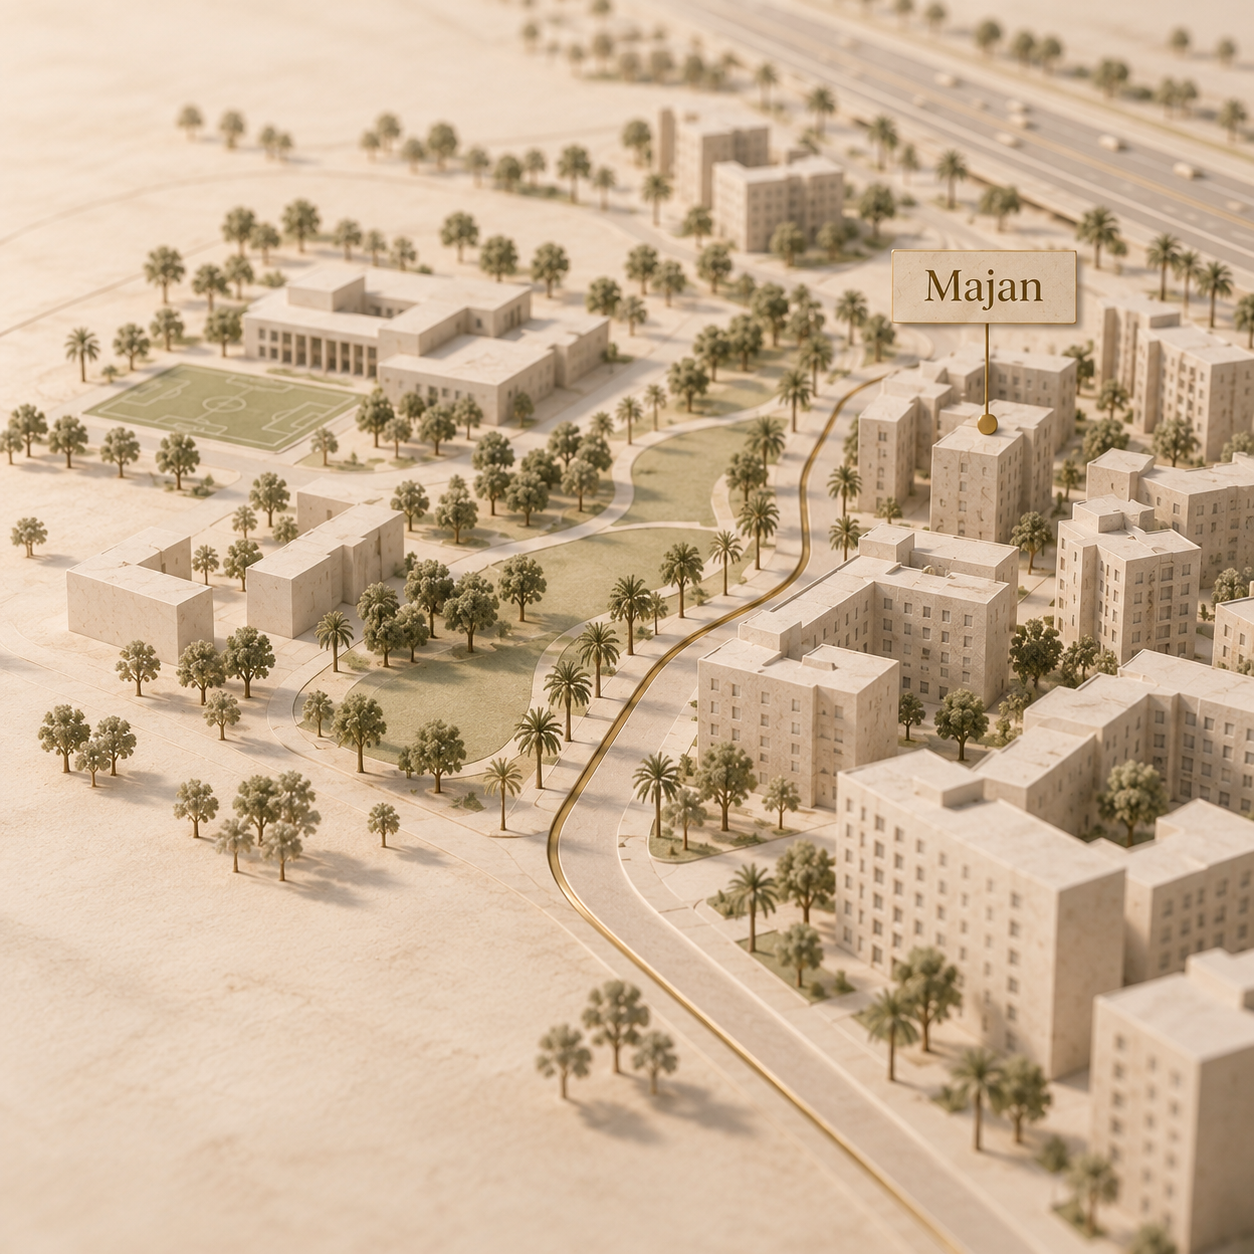
The Villa and Villanova sit close together on the map. Farther southwest, Serena and Al Waha form another pair, with Mudon and Remraam beyond them. Dubai Properties describes each as a community with its own homes and layout. Dubai Holding places The Acres on the side served by Sheikh Zayed bin Hamdan Al Nahyan Street and Emirates Road. Those road names help locate a home, though they don't form a single perimeter around every community.
The first pin is the place OpenStreetMap calls Dubai Land. Each road line begins at that same point, which makes the journeys to the airport, Downtown, the financial district and Dubai Marina comparable. A drive from a townhouse in Mudon starts in a different part of the city. The pin for Dubai Mall marks the Downtown destination, while Dubai Outlet Mall sits on the Dubai–Al Ain Road side of Dubailand.
A neighbourhood pin marks a place you can locate by name. The map gives its position, while the project and district tables tell you which registered homes enter the prices.
Show the numbersHide the numbers
| Place | What | |
|---|---|---|
| Dubai Land | community | |
| The Villa | community | |
| Villanova | community | |
| Remraam | community | |
| Mudon | community | |
| Serena | community | |
| Living Legends | community | |
| Al Waha Villas | community | |
| Global Village | landmark | |
| Dubai Outlet Mall | mall | |
| Gems First Point School (The Villa) | school | |
| HealthHub Clinic | clinic | |
| Spinneys | supermarket | |
| Circle park | park | |
| Centrepoint | metro station | |
| Silicon Central | mall |
How many properties sold in Dubailand each year?
The DLD registered 11,687 sales worth AED 24,568,442,456 in the nine communities during 2025. From January to 11 November 2026 it registered 7,193 sales worth AED 11,798,895,095.
The sales chart follows the registration date. The DLD counts all property types, including land, under the registration labels Off-Plan and Ready. Among Ready registrations in the 12 months to 11 November 2026, the DLD counted 83 land sales at The Acres and 19 at The Villa. A home can appear again when it sells to a new owner. The height of a column tells you how many sales took place, while the value chart adds the dirham prices on the registrations with usable amounts.
The last full calendar years cover equal periods. The DLD counted 8,115 sales in 2024 and 11,687 in 2025 across these communities. A change in the number of apartments sold in the Residence Complex has a different effect on the total value from a change in villa sales in Mudon. The value chart reflects both the prices people paid and the kinds of property that changed hands.
For a full year ending on the latest available day, the DLD counted 8,697 registrations worth AED 14,355,624,442 in the 12 months to 11 November 2026. That period includes the closing weeks of the previous calendar year.
Show the numbersHide the numbers
| Sales by calendar year | |
|---|---|
| 2006 | 1 |
| 2007 | 1 |
| 2008 | 1,259 |
| 2009 | 3,973 |
| 2010 | 693 |
| 2011 | 1,466 |
| 2012 | 1,845 |
| 2013 | 2,905 |
| 2014 | 2,781 |
| 2015 | 2,097 |
| 2016 | 1,381 |
| 2017 | 2,037 |
| 2018 | 1,534 |
| 2019 | 2,159 |
| 2020 | 1,830 |
| 2021 | 2,643 |
| 2022 | 3,638 |
| 2023 | 4,610 |
| 2024 | 8,115 |
| 2025 | 11,687 |
| 2026 so far | 7,193 |
Show the numbersHide the numbers
| Registered sale value by year | |
|---|---|
| 2006 | 0 |
| 2007 | 0 |
| 2008 | 1.5 |
| 2009 | 3.7 |
| 2010 | 1.3 |
| 2011 | 1.9 |
| 2012 | 2.7 |
| 2013 | 4 |
| 2014 | 4.2 |
| 2015 | 4.1 |
| 2016 | 3 |
| 2017 | 3.9 |
| 2018 | 3.9 |
| 2019 | 3.7 |
| 2020 | 2.8 |
| 2021 | 4.2 |
| 2022 | 6.5 |
| 2023 | 7.7 |
| 2024 | 19.5 |
| 2025 | 24.6 |
| 2026 so far | 11.8 |
What does a square foot cost in Dubailand?
Across the nine communities, DLD registrations in the 12 months to 11 November 2026 had medians of AED 1,448 per sq ft on 6,413 qualifying Off-Plan sales and AED 1,074 per sq ft on 1,623 qualifying Ready sales. Across Dubai, the corresponding medians were AED 1,792 per sq ft on 107,777 qualifying Off-Plan sales and AED 1,427 on 37,155 qualifying Ready sales.
For an apartment, price per square foot puts the amount paid alongside the home's registered floor area. The same calculation works for a villa where the register gives the size of the built home. A villa sold with the area of the entire plot would produce a price for a different thing. It still contributes to the sales count, while the floor-area comparison leaves it out.
The two lines trace sales before completion and sales of ready homes separately. A new group of studios going on sale can shift the midpoint for off-plan homes even if prices in an existing tower stay the same. The mix matters for the ready line too. A year with more transactions in Remraam draws on a different set of homes from one with more villa sales in Mudon.
The table gives the size of each comparison group. Silicon Oasis and International City Phase 1 are nearby named master communities. The citywide row includes qualifying sales throughout Dubai. Following the same registration type across the rows keeps the stage of sale consistent.
- Off-plan
- Ready
Show the numbersHide the numbers
| Off-plan | Ready | |
|---|---|---|
| 2011 | 836 | 690 |
| 2012 | 738 | 683 |
| 2013 | 787 | 744 |
| 2014 | 762 | 875 |
| 2015 | 819 | 780 |
| 2016 | 800 | 800 |
| 2017 | 735 | 814 |
| 2018 | 784 | 766 |
| 2019 | 709 | 582 |
| 2020 | 737 | 550 |
| 2021 | 749 | 572 |
| 2022 | 865 | 694 |
| 2023 | 965 | 711 |
| 2024 | 1,257 | 821 |
| 2025 | 1,413 | 918 |
| 2026 so far | 1,458 | 1,085 |
| Area | Stage | Qualifying sales | Median AED/sq ft |
|---|---|---|---|
| Dubailand coverage | Off-Plan | 6,413 | 1,448 |
| Dubailand coverage | Ready | 1,623 | 1,074 |
| Dubai | Off-Plan | 107,777 | 1,792 |
| Dubai | Ready | 37,155 | 1,427 |
| International City Phase 1 | Off-Plan | 278 | 1,150 |
| International City Phase 1 | Ready | 1,185 | 655 |
| Silicon Oasis | Off-Plan | 716 | 1,627 |
| Silicon Oasis | Ready | 1,016 | 961 |
What does it cost to buy or rent a home in Dubailand?
The middle half of 406 ready one-bedroom flat sales ran from AED 595,000 to AED 818,750 in the 12 months to 11 November 2026 (DLD). A new one-bedroom tenancy had a median annual rent of AED 57,000 across 1,852 contracts starting in the 12 months to 12 November 2026 (DLD).
The sale table follows the amount paid for the whole home. The low and high ends of each band mark the lower and upper quarters of the same group of sales that supplies its median. Half of the qualifying homes sold inside that band. You can read across a row to see how much a particular size of home cost in total and how much its floor area cost per square foot.
The rent table answers a different household question. Ejari is Dubai's tenancy registration system, and its annual rent field lets you compare contracts even when tenants pay in different instalments. A studio has its own row. A flat with a separate bedroom goes into the next group. Each agreement counted here covers a single flat and enters the figures on its start date.
For someone already living in the area, the renewal column gives the midpoint among tenants who renewed. A small count without a median means there were too few comparable agreements or sales to quote a price. The rent figures cover flats even where a community also has villas.
| Area | Stage | Qualifying sales | Median AED/sq ft |
|---|---|---|---|
| Dubailand coverage | Off-Plan | 6,413 | 1,448 |
| Dubailand coverage | Ready | 1,623 | 1,074 |
| Dubai | Off-Plan | 107,777 | 1,792 |
| Dubai | Ready | 37,155 | 1,427 |
| International City Phase 1 | Off-Plan | 278 | 1,150 |
| International City Phase 1 | Ready | 1,185 | 655 |
| Silicon Oasis | Off-Plan | 716 | 1,627 |
| Silicon Oasis | Ready | 1,016 | 961 |
| Area | Stage | Qualifying sales | Median AED/sq ft |
|---|---|---|---|
| Dubailand coverage | Off-Plan | 6,413 | 1,448 |
| Dubailand coverage | Ready | 1,623 | 1,074 |
| Dubai | Off-Plan | 107,777 | 1,792 |
| Dubai | Ready | 37,155 | 1,427 |
| International City Phase 1 | Off-Plan | 278 | 1,150 |
| International City Phase 1 | Ready | 1,185 | 655 |
| Silicon Oasis | Off-Plan | 716 | 1,627 |
| Silicon Oasis | Ready | 1,016 | 961 |
Which Dubailand districts and buildings had the most sales?
Dubai Land Residence Complex accounted for 6,569 of the 8,697 sales in these communities in the 12 months to 11 November 2026 (DLD). Living Legends followed with 642 sales over the same period.
In the Residence Complex, a tower can have a trading history of its own. Samana Boulevard Heights heads the building rows below, while Le Blanc Residence and Cove Grand Residence have their own entries even though both carry the Imtiaz name. In Living Legends the register identifies Cinderella as a building. Its activity is already included in the Living Legends community row. Adding the building figures to the district totals would count the same transactions twice.
The Villa illustrates why the sales and floor-area columns belong side by side. Its properties changed hands during the year, but none of the sales supplied a qualifying built-home price per square foot. The same applies at The Acres. Where the registered size is land area, dividing the amount paid by that size answers a question about the plot.
Select a community to open its own record where one is available. Within the table you can look up an individual building by name. The named building rows show the busiest buildings by registrations across the communities covered here.
| Area | Stage | Qualifying sales | Median AED/sq ft |
|---|---|---|---|
| Dubailand coverage | Off-Plan | 6,413 | 1,448 |
| Dubailand coverage | Ready | 1,623 | 1,074 |
| Dubai | Off-Plan | 107,777 | 1,792 |
| Dubai | Ready | 37,155 | 1,427 |
| International City Phase 1 | Off-Plan | 278 | 1,150 |
| International City Phase 1 | Ready | 1,185 | 655 |
| Silicon Oasis | Off-Plan | 716 | 1,627 |
| Silicon Oasis | Ready | 1,016 | 961 |
Which projects are in Dubailand, and who builds them?
Dubai Properties is the master developer behind Villanova and several other Dubailand communities, while individual projects have their own registered developers. The DLD project file of 1 November 2026 lists 53,486 units and villas across 170 matched project registrations.
At Villanova Amaranta the DLD names North Dubailand Projects as the project company and Dubai Properties as the master developer. Those names describe different roles on the same development. The name above a sales entrance can also differ from the registered company's name. The project number lets you follow a phase from its sales records to its entry in the DLD project enquiry.
The status column gives the stage in the project file on its download day. Compare the two date columns for a finished phase. A planned end is the date on the schedule, while completion is the date entered when the register records that event. Where the completion field is empty, the planned date alone cannot establish that an individual owner has received the keys.
The homes figure adds the unit and villa fields once per matched project. It includes planned stock as well as completed stock. It cannot tell you how many households have moved in. The sales column covers the latest year and can therefore show activity even on a project that finished years ago.
| Area | Stage | Qualifying sales | Median AED/sq ft |
|---|---|---|---|
| Dubailand coverage | Off-Plan | 6,413 | 1,448 |
| Dubailand coverage | Ready | 1,623 | 1,074 |
| Dubai | Off-Plan | 107,777 | 1,792 |
| Dubai | Ready | 37,155 | 1,427 |
| International City Phase 1 | Off-Plan | 278 | 1,150 |
| International City Phase 1 | Ready | 1,185 | 655 |
| Silicon Oasis | Off-Plan | 716 | 1,627 |
| Silicon Oasis | Ready | 1,016 | 961 |
What is it like to live in Dubailand?
From the Dubai Land pin, the drive to Dubai International Airport is 30.5 km or 33 minutes without traffic (OpenStreetMap, 15 November 2026). GEMS First Point School at The Villa received Very Good and The Aquila School received Good in KHDA’s 2023–24 inspections.
For the school run, the starting address matters. OpenStreetMap places GEMS First Point close to the map pin at the Villanova and The Villa end of Dubailand. For The Aquila School, the KHDA directory gives the campus details and inspection report. The year beside a school rating is the inspection year. It lets you distinguish the published assessment from the date you look up the school.
For everyday shopping, Spinneys lists The Villa Centro, while Dubai Outlet Mall gives Dubai–Al Ain Road as its address. Silicon Central is another shopping destination on the Silicon Oasis side. HealthHub lists a Silicon Oasis clinic, and Aster Clinic gives Skycourts as its Dubailand address. For outdoor space there is Circle park near the map origin. For a larger outing, Global Village publishes its own visitor information.
Public transport also depends on which entrance you use. Dubai Outlet Mall lists RTA buses 66 and 67 along Dubai–Al Ain Road as at 21 November 2026. Centrepoint serves the operating Red Line. RTA describes Academic City and Silicon Oasis as stops on the Blue Line project, so a station marked there on a map does not establish a train service today.
0.59 km
Straight line from Dubai Land, OpenStreetMap, 15 November 2026.
1.51 km
Straight line from Dubai Land, OpenStreetMap, 15 November 2026.
1.53 km
Straight line from Dubai Land, OpenStreetMap, 15 November 2026.
3.54 km
Straight line from Dubai Land, OpenStreetMap, 15 November 2026.
3.64 km
Straight line from Dubai Land, OpenStreetMap, 15 November 2026.
3.74 km
Straight line from Dubai Land, OpenStreetMap, 15 November 2026.
How can you check a Dubailand address with the DLD?
The Dubai Land Department has separate look-ups for project status, approved service charges and the rental index. The community, project and building names on the property documents narrow each enquiry to the relevant address.
For a home sold before completion, the project number in the table above identifies its registered phase. For example, a Villanova address may carry an Amaranta or La Rosa phase name. The project status enquiry lets you look up that registration. A date in the planned end field describes the project schedule, and the completion field records a different event. Neither field records a particular owner's appointment to collect keys.
For a completed apartment, the DLD Service Charge Index is the official reference for approved common-property charges under Mollak, Dubai's system for jointly owned property. The building and charge year matter here. A service charge from a neighbouring tower would describe a different property, even where both addresses have the same master community.
On the tenancy side, Ejari identifies the registered contract. The DLD Rental Index uses tenancy details including the contract end date. Its result answers a question about a particular tenancy. The annual medians on this page describe the contracts people actually registered over the stated period.
Questions about Dubailand
Dubailand is the wider destination, and Dubai Land Residence Complex is one community within it. For a particular home, its district, building and stage of sale give a closer comparison than the destination name alone.
A search for Dubailand can take you to very different addresses. A reference to Skycourts points to apartment towers in Dubai Land Residence Complex. Villanova and Serena have their own named phases, and The Villa is the name of a particular community as well as a phrase someone might use to describe their house. Dubai Properties lists these neighbourhoods individually. The Dubai Land Department, which uses the word dubailand in its web address, is the government department that registers property across the emirate.
The same distinction matters for a journey. A destination entered simply as Dubai Land can return a community pin, while a search for the mall could mean Dubai Outlet Mall on Dubai–Al Ain Road or Dubai Mall in Downtown. The car routes on the map name their endpoints. The local distances use the first community pin as their starting point, so they describe a different trip from one beginning at a front door in Remraam or a school gate in The Villa.
What is the Dubailand area?
Dubailand is an inland destination of residential communities and leisure attractions. The Villa, Villanova, Serena, Mudon, Al Waha and Remraam appear on Dubai Properties’ destination page.
Is Dubailand cheap?
A ready one-bedroom flat had a median sale price of AED 690,000 across 406 qualifying sales in the nine communities in the 12 months to 11 November 2026 (DLD). For a tenant, the comparable new-contract figure was AED 57,000 a year across 1,852 one-bedroom agreements in the 12 months to 12 November 2026 (DLD).
Does Dubailand have a metro?
As at 21 November 2026, RTA identifies no operating station named Dubailand. Centrepoint is on the Red Line, while the planned Blue Line route runs through Silicon Oasis to Academic City.
Is Dubailand a theme park?
Dubailand is the wider destination. Global Village is a separately named visitor attraction, and its operator publishes admission and visitor information under that name.
How this record is made
Sales come from Dubai Land Department registrations through 11 November 2026, and rents from tenancy contracts starting by 12 November 2026. The project names, companies and stages come from the DLD project file dated 1 November 2026.
The place names tie the files together. The sales scope includes the master projects Dubai Land Residence Complex, Living Legends, The Villa, Mudon, Remraam and Al Waha Villas. Named project phases add Villanova, Serena and The Acres as well as entries for communities where the master name can be missing. Each phase is matched inside its DLD area and a sale that matches twice counts once. Properties elsewhere in Wadi Al Safa fall outside those matches.
Each annual sales total includes registrations with a valid date. Prices per square foot use the middle price across qualifying residential flats and villas with the home's floor area. Price and rent medians need at least ten comparable observations. Rent contracts have fewer project identifiers than sales, so a phase-level rent includes only contracts that carry its project number. withlida counts a single-flat agreement when its registered annual rent is at least AED 5,000. This floor is withlida’s counting rule.
The Dubai Land Department supplies the open data under the Dubai Open Data Licence. Dubai Properties and Dubai Holding describe the communities. KHDA supplies school inspections, RTA describes rail service, and OpenStreetMap contributors supply positions and roads. 2026-11-21 · published · First Dubailand record. Sources accessed 21 November 2026.
Show the numbersHide the numbers
| One-bedroom rent by contract start year | |
|---|---|
| 2012 | 32.4 |
| 2013 | 40 |
| 2014 | 50 |
| 2015 | 55 |
| 2016 | 56 |
| 2017 | 55 |
| 2018 | 50 |
| 2019 | 40 |
| 2020 | 34 |
| 2021 | 30 |
| 2022 | 35 |
| 2023 | 42 |
| 2024 | 50 |
| 2025 | 55 |
| 2026 so far | 56 |
Before you act
This record provides general information and does not provide financial, legal or investment advice. Verify current requirements with the Dubai Land Department, RERA or a licensed professional before you commit.
Areas in Dubailand
 Lida Moghaddam
Architect-turned-real-estate-specialist based in Dubai. She helps buyers, sellers, and investors read property with a designer's eye — structure, location, and long-term value.
Disclaimer: This page is for general informational purposes only. It is based on cited public data and published under Lida Moghaddam's RERA-licensed masthead. It is not financial, legal, or investment advice. Dubai's property market moves quickly, so figures, yields, and rules may change or become outdated by the time you read this. Verify current information with the relevant authority or a qualified professional before acting. Read the full disclaimer.