Dubai residential transactions: week ending 24 September 2026
 Lida Moghaddam
Disclaimer: This article is for general informational purposes only. It is based on cited public data and published under Lida Moghaddam's RERA-licensed masthead. It is not financial, legal, or investment advice. Dubai's property market moves quickly, so figures, yields, and rules may change or become outdated by the time you read this. Verify current information with the relevant authority or a qualified professional before acting. Read the full disclaimer.
Table of contents
The Dubai Land Department's official query returned 2,348 residential sale records worth AED 5,561,538,842.07 for the DLD week ending 24 September 2026, extracted at 10:25 GST on 25 September. Against the immediately preceding seven-day query with identical filters, the record count was 3.22% lower and total value was 4.83% higher.
The week ending 24 September returned 2,348 sale records
The clearest weekly read is a four-part comparison: record count, total value, average row value and median row value. The DLD Real Estate Data service supplied the rows; the arithmetic was recomputed from those rows after the response was saved on 25 September 2026.
Source: DLD Real Estate Data, final responses extracted 25 September 2026; calculations from the saved rows.
The neutral read: fewer records carried a higher combined value and average row value, while the two medians were close. That combination reflects the mix of rows registered in each window; it does not establish a citywide price movement.
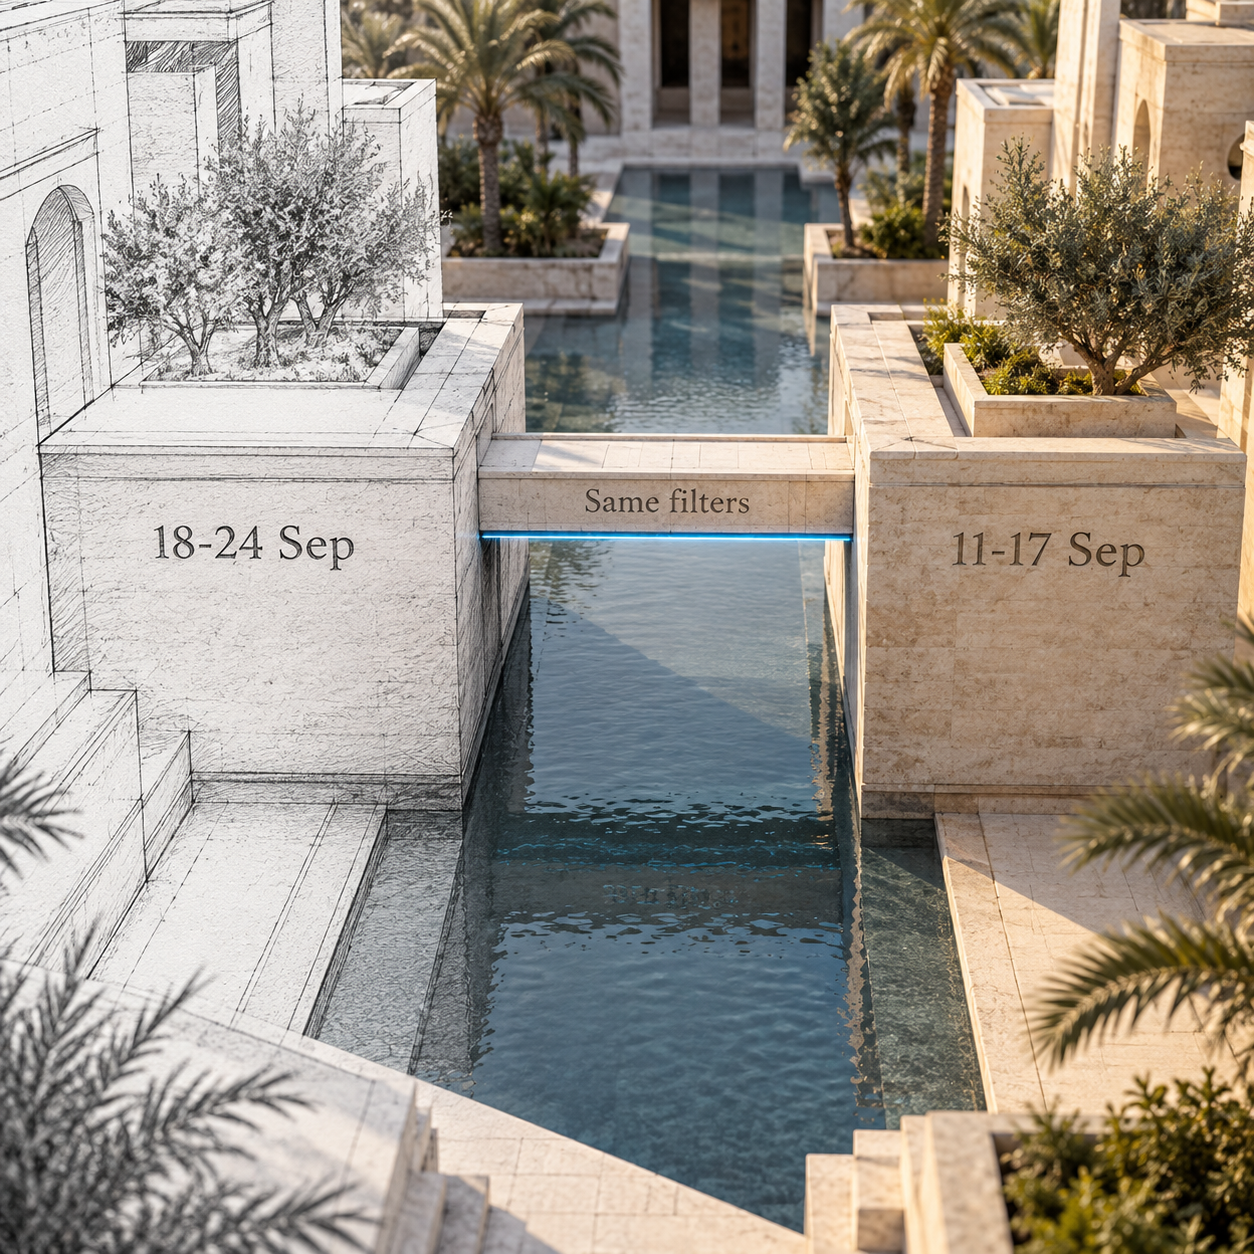
This report follows the 13 to 19 September transaction pulse. The two pulses are separate extraction snapshots because DLD populations can settle after the named period.
Off-plan represented 64.05% of the latest record count
The latest response divided into 1,504 off-plan records and 844 ready records. Here, off-plan means the row carries DLD's IS_OFFPLAN=1 registration flag; ready means IS_OFFPLAN=0. Those are registry labels, not a separate inference about construction progress.
Source: DLD Real Estate Data, final responses extracted 25 September 2026; registration type from DLD's IS_OFFPLAN field.
The neutral read: off-plan made up 64.05% of the latest record count and 58.14% of value. Ready made up 35.95% of count and 41.86% of value. Each pair reconciles independently to the current-period total.
The current off-plan count difference was -135 records, or -8.24%, while its value difference was AED 241,872,949.70, or 8.09%. The ready count difference was 57 records, or 7.24%, and its value difference was AED 14,336,311.24, or 0.62%. These are comparisons between two saved DLD response populations, not projections.
Unit records carried 75.32% of the latest value
DLD labelled 2,104 current rows as Unit, 113 as Building and 131 as Land. These property-type labels sit inside the Residential usage filter; the analysis does not relabel them as apartments, villas or plots.
Source: DLD Real Estate Data, final responses extracted 25 September 2026; property type from DLD's PROP_TYPE_EN field.
The neutral read: Unit rows represented 89.61% of the latest count and 75.32% of value. Building rows represented 4.81% of count and 8.08% of value; Land rows represented 5.58% of count and 16.60% of value.
Because the three property-type subtotals reconcile separately to the same grand total, a correct headline cannot conceal a mismatched stage subtotal. The calculation file performs the same test for registration type and area.
Jumeirah Village Circle had the largest area row count
The five DLD area labels below had the largest row counts in the latest response. This is a concentration table, not an area price ranking: each median is calculated only from the rows returned for that label in the 18 to 24 September DLD filter window.
Source: DLD Real Estate Data, current response extracted 25 September 2026; area labels from DLD's AREA_EN field.
The neutral read: Jumeirah Village Circle supplied the largest row count among DLD's returned area labels, while Business Bay carried the largest total value within this five-area cut. Different property and registration mixes mean neither result is a like-for-like home-price measure.
For a map of what each official surface can and cannot answer, use the DLD real-estate data source guide before joining this weekly pulse to another dataset.
The saved query defines the population
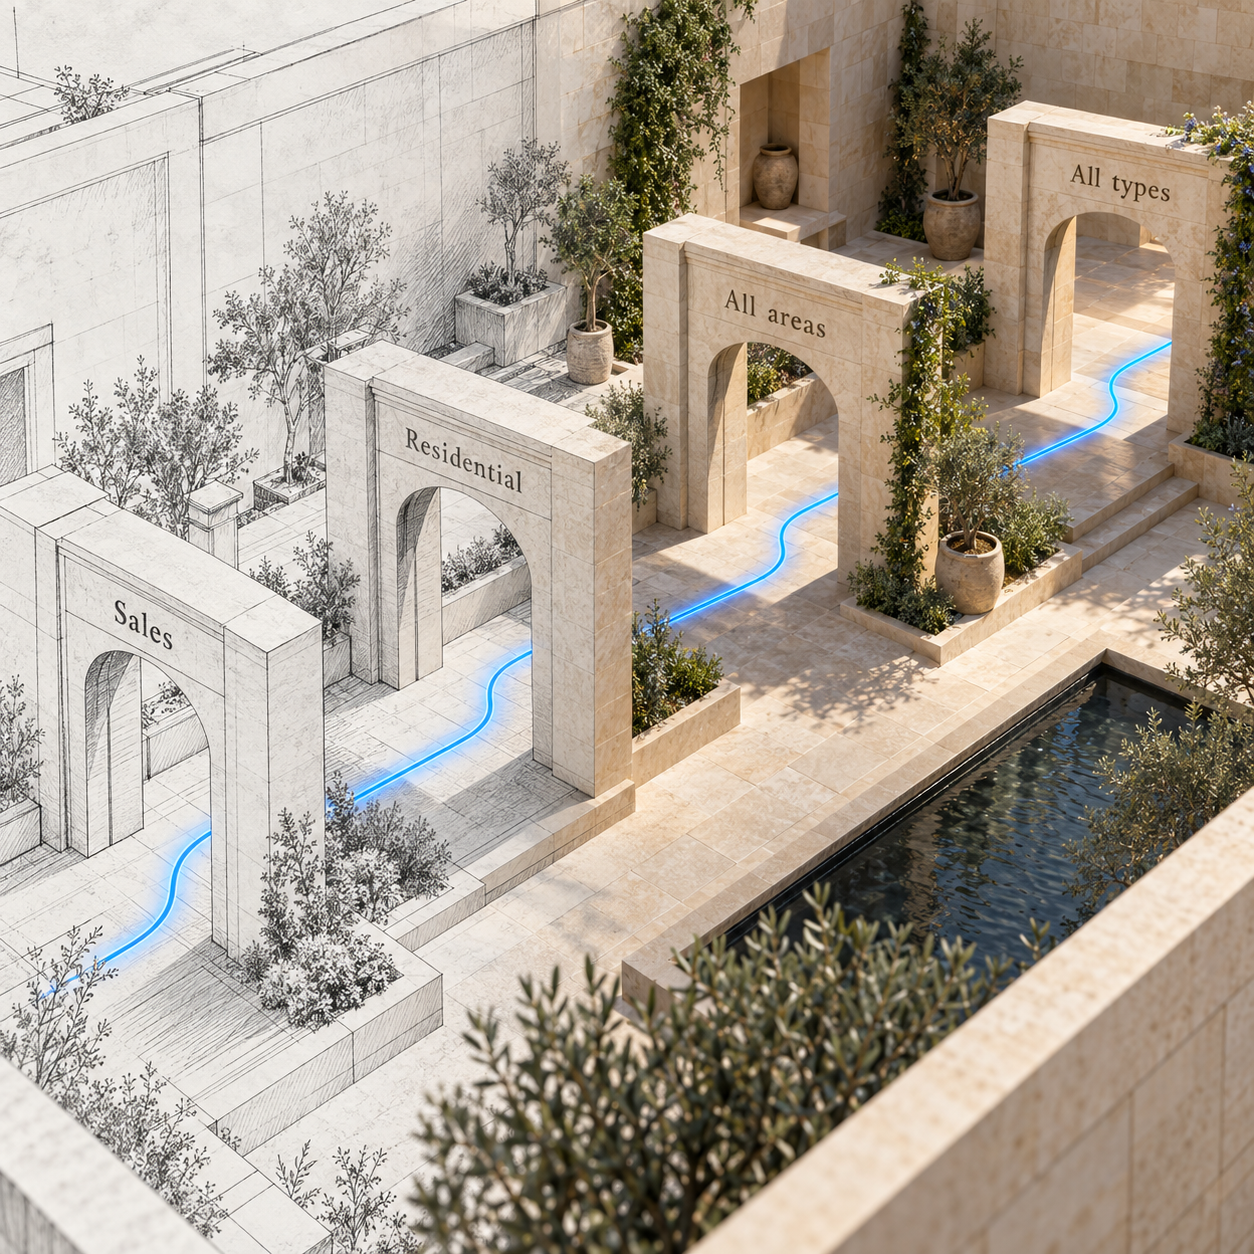
The population is residential sales across all returned Dubai areas, registration types, freehold flags and DLD property types. Mortgages, gifts, commercial usage and other usage are outside it.
The neutral read: this is one defined residential-sales population. It is not DLD's total for every real-estate procedure.
The pulse measures registry activity, not a forecast
This weekly pulse establishes how many DLD rows matched the saved filter, what those rows summed to and how the population divided by registry fields. It does not isolate a matched-home price change or predict the next week.
Source: DLD Real Estate Data for the query fields and saved 25 September 2026 response; scope limits are defined by the fields used here.
The neutral read: use this pulse for a dated registry observation. A price, yield or project-status question needs a dataset designed for that question.
FAQ, checked 25 September 2026
How many Dubai residential sale records were returned for the week ending 24 September 2026?
The saved DLD Real Estate Data query returned 2,348 records worth AED 5,561,538,842.07 at 10:25 GST on 25 September 2026. The count is DLD response rows, not an asserted count of unique legal deals.
How did the latest DLD week compare with the preceding seven days?
Under identical filters, the current window had 78 fewer records, a -3.22% difference, and AED 256,209,260.94 more total value, a 4.83% difference. The median row value was AED 1,320,000.00 versus AED 1,322,162.50.
Does this DLD total include mortgages, gifts or commercial transactions?
No. The 25 September 2026 extraction sets Transaction Type to Sales and Usage to Residential. Mortgages, Gifts, Commercial and Other usage are excluded; registration type, freehold status, area and property type remain open.
Are DLD response rows the same as unique transactions?
Not necessarily. The preceding response contains 2,426 rows and 2,424 distinct transaction numbers because two numbers each occupy two rows with different returned fields. No row was silently dropped, so every count here is labelled as a record count.
Lida MoghaddamArchitect-turned-real-estate-specialist based in Dubai. She helps buyers, sellers, and investors read property with a designer's eye — structure, location, and long-term value.